

As regards external transactions of fabrics in 2013 Italy displays a different trend of exports and imports: export sales posted a slower decrease as against 2012. On the other hand, import trade already shows a pace change with a 3.2% (at 1.9 billion Euro) increase of knitted and cotton cloth sales, whereas export trade of the segment, though featuring a negative spread, is expected to decelerate by -1.4% to the end of the year (total deceleration value over 4.3 billion Euro).
Average Data in Each Macro Area
Let’s consider foreign trade of knitted fabrics and of woven fabrics mostly composed of natural fibres (see diagram): sales abroad posted a comprehensive fall by -3.2%, reaching totally over 3 billion Euro. In turn, as mentioned above, after a double digit decrease posted last year, imports posted a positive result at +3.7% (approx. 1.4 billion Euro). Volumes showed a similar development: exports posted a crunch of outflowing volumes slightly worse than the value spread; on the other hand, imports are growing.
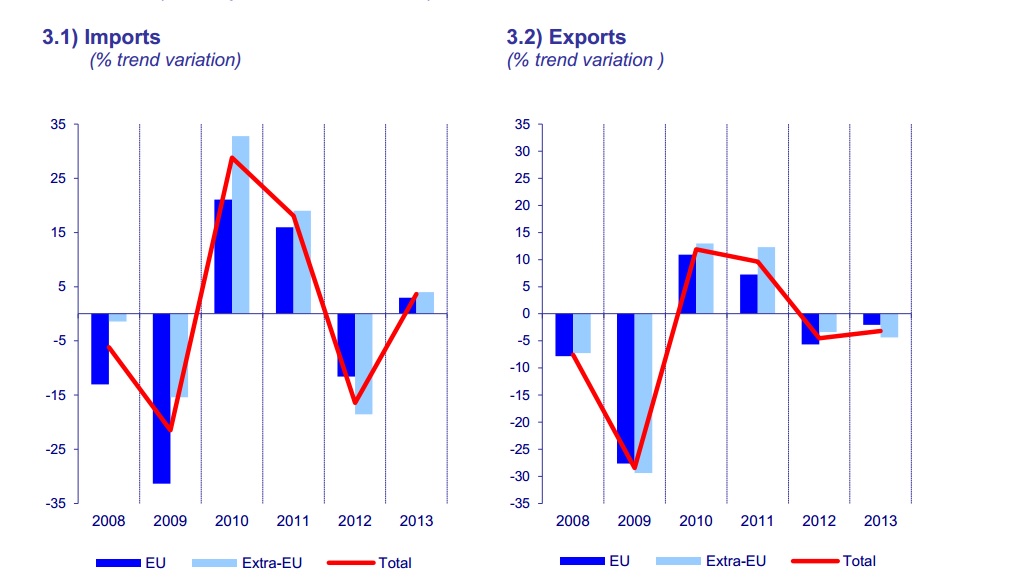
The products taken into account represent a sub-group (including only woven fabrics with at least 50% of natural fibre) of those used for the representation of the industry’s performance. Knits are instead considered as a single group in both aggregates. Source: SMI on ISTAT data
As regards destinations, in the period under consideration, the European single market is more favourable than the international market: the former showing a moderate loss (-2%), the latter losing 4.4%, against the trend sensed in 2010-2012, with a better performance in international regions. The EU single market continues to absorb the majority of Italian fabrics export, at 52.1%; supplies from the international market (covering 67.7% of fabrics imports in Italy) posted a 4% growth, whereas supplies within the single market posted a 3% growth.
Trends in Different Countries
And what about each single country, as major partner of Italian weaving mills? As shown in Table 1, the lion share of Italian fabrics sales areas goes once again to the German market, absorbing 11.3% of total exports of the commodity categories examined. In fact, Germany posted 345 million Euro of exports from Italy with a slower decrease at -1.5%, following last year’s strong fall. Romania, France and Tunisia follow the trend fashioning a falling export of fabrics from Italy; Romania posted more or less the same rate as last year, France decelerates at -5.7% with Tunisia too falling at -13.1%. The fifth place among the major sales markets goes to China, which, after a highly performing two-year period, suffers a setback (-2.7%); mainly due to the negative balance of cotton and combed wool cloths, against a growing knitted fabrics trend. All in all Hong Kong decelerates at -0.9%. Among the first ten destinations Turkey alone posts a quite good growth (+3.6%), pulled by combed wool cloths. On the contrary, even Spain and the United States lose some market shares, while Japan settles its 18% growth, posted in 2012, at -0.4%. Bulgaria (+4%), Poland (+5.8%) and Switzerland (+4.9%) showed a relatively positive trend.
Tab. 1 – Foreign trade of textiles: analysis by country
IMPORTS EXPORTS
| COUNTRY OF ORIGIN | MLN. OF EUROS | VAR.% | % ON TOTAL | DESTINATION COUNTRIES | MLN. OF EUROS | VAR.% | % ON TOTAL | |
| Totalof which: | 1396 | 3.7 | 100.0 | Totalof which: | 3062 | -3.2 | 100.0 | |
| EU28 | 451 | 3.0 | 32.3 | EU28 | 1596 | -2.0 | 52.1 | |
| Extra EU28 | 945 | 4.0 | 67.7 | Extra EU28 | 1466 | -4.4 | 47.9 | |
| First 15 suppliers | First 15 customers | |||||||
| China | 361 | -0.5 | 25.9 | Germany | 345 | -1.5 | 11.3 | |
| Turkey | 294 | 19.0 | 21.1 | Rumania | 235 | -3.3 | 7.7 | |
| Czech Republic | 92 | 0.5 | 6.6 | France | 222 | -5.7 | 7.3 | |
| Pakistan | 92 | 14.8 | 6.6 | Tunisia | 191 | -13.1 | 6.2 | |
| Germany | 82 | 4.8 | 5.9 | China | 162 | -2.7 | 5.3 | |
| Spain | 58 | 2.1 | 4.2 | Hong Kong | 148 | -0.9 | 4.8 | |
| France | 42 | 23.2 | 3.0 | Turkey | 137 | 3.6 | 4.5 | |
| South Korea | 38 | -4.6 | 2.7 | Spain | 127 | -8.4 | 4.2 | |
| India | 38 | -12.9 | 2.7 | USA | 126 | -2.6 | 4.1 | |
| UK | 28 | -2.3 | 2.0 | Japan | 106 | -0.4 | 3.5 | |
| Belgium | 27 | 5.9 | 1.9 | Portugal | 103 | -5.1 | 3.4 | |
| Hungary | 24 | 28.4 | 1.7 | Bulgaria | 98 | 4.0 | 3.2 | |
| Rumania | 23 | -9.4 | 1.7 | UK | 94 | -1.9 | 3.1 | |
| Egypt | 21 | -3.2 | 1.5 | Poland | 73 | 5.8 | 2.4 | |
| Tunisia | 21 | -24.2 | 1.5 | Switzerland | 72 | 4.9 | 2.4 |
Source: SMI on ISTAT data
Turkey and China Continue to Be the Two “Main Suppliers”
As concerns the origin markets of fabrics imported to Italy, Turkey is coming nearer and nearer as against the last few months, when China was undoubtedly playing the leading role as compared with other supplying countries: whereas the latter supplies 25.9% of imported fabrics (against 27% in the same period of 2012), Turkey reached 21.1%, with a three point increase in one year. In front of a settled import trend from China (last year China had already lost over 25% in value), Turkish fabrics post a 19% growth, totalling approximately 300 million Euro.
At a considerably lower level than Turkey and China, the Czech Republic shows a substantial stability, whereas Pakistan (+14,8%), supplying 6.6% of fabrics imported to Italy, posted a double digit growth.
Analysis by Segment
There are even data on foreign trade regarding different types of fabrics, still referred to the first ten months of the year: the trend is positive for sales abroad of knitted fabrics only, contrary to the average trend of the segment, with a +4,2% growth.
A decrease to a greater or lesser extent is to be noticed in other segments. Export of cotton cloth is down by 5.7%, of linen by 3%, of pure silk by 3.1%. Wool posted a 5.9 % decrease in sales abroad as against combed wool and a 7.1% decrease in carded wool cloth. Imports of both knitted (+9.9%) and cotton fabrics (+5.1%) grew again, whereas imports of woolen fabrics continues to lose ground with combed silk and linen ranging between approximately 6% and 7%.


